What is happening with JDSU recently? The stock went from over a 100 to about 2 during the recession and now it's creeping up 5% to 6%, giving back some and then coming back up.
Are the day traders moving this up and down? The stock has become a staple of Cramer, CNBC shows and many other market publications.
What's been happening? I bought some stocks of JDSU and don't know if I should cash out or just hold on to it.
What do you suggest?

Thursday, January 19, 2006
Tuesday, January 17, 2006
Mad Money By Jim Cramer - Did you miss a show?
I was watching "Mad Money" by Jim Cramer the other day (it's usually aired at 6 and 9 p.m. EST on CNBC) and I must say, man, that guy is energetic or what!!
I watched his show a couple of times and then decided to invest in some stocks that he was recommending (like Conexant Technologies CNXT and Shanda Interactive SNDA). And guess what - I made some money on my first days of trading.
By the way, I opened a Scottrade account since it seemed to be the best thing for me as a novice to investing.
Now, the problem was that I could not watch each and every show and even if I did, the fast pace of the show virtually guaranteed that there is no way a person keep track of everything.
After some searching I found this gem of site which actually posts every show along with the detailed transcript.
The website is http://www.madmoneyrecap.com/index.html (it's called Mad Money Recap)
Fantastic!!
Value Line Investment Survey
For the longest time, Value Line has been one the very best systems and publications for investing in common stocks and related markets.
According to them, Value Line has has outperformed the DOW by 19 to 1 over a 40-year span that covers bull and bear markets. We've delivered 19,913% gains for those who invested in our portfolio of #1-ranked stocks.
They are now giving a $75 trial for 13 weeks. What this gives you:
Here is a link if you would like to try it too.
https://www.2p9.com/ValueLine/InvestmentSurvey/0904Camp/landing.cfm?trkid=20476S33594#
According to them, Value Line has has outperformed the DOW by 19 to 1 over a 40-year span that covers bull and bear markets. We've delivered 19,913% gains for those who invested in our portfolio of #1-ranked stocks.
They are now giving a $75 trial for 13 weeks. What this gives you:
- Summary & Index - a 40-page update listing the current Timeliness and Safety rankings for all 1,700 stocks
- Selection & Opinion - an insightful 12-16 page report featuring sample portfolios for different types of investors
- Ratings & Reports - presenting about 130 new full-page reports on the 1,700 stocks followed by Value Line
- Plus a bunch more stuff.
Here is a link if you would like to try it too.
https://www.2p9.com/ValueLine/InvestmentSurvey/0904Camp/landing.cfm?trkid=20476S33594#
Monday, January 16, 2006
More about what a P/E ratio is
A quick primer on P/E ratios
The P/E looks at the relationship between the stock price and the company’s earnings. The P/E is the most popular metric of stock analysis, although it is far from the only one you should consider.

The P/E looks at the relationship between the stock price and the company’s earnings. The P/E is the most popular metric of stock analysis, although it is far from the only one you should consider.
You calculate the P/E by taking the share price and dividing it by the company's EPS (Earnings Per Share)
P/E = Stock Price / EPSFor example, a company with a share price of $400 and an EPS of 10 would have a P/E of 40 ($400 / 10 = 5).
What does P/E tell you? The P/E gives you an idea of what the market is willing to pay for the company’s earnings. The higher the P/E the more the market is willing to pay for the company’s earnings. Some investors read a high P/E as an overpriced stock and that may be the case, however it can also indicate the market has high hopes for this stock’s future and has bid up the price.
Conversely, a low P/E may indicate a “vote of no confidence” by the market or it could mean this is a sleeper that the market has overlooked. Known as value stocks, many investors made their fortunes spotting these “diamonds in the rough” before the rest of the market discovered their true worth.
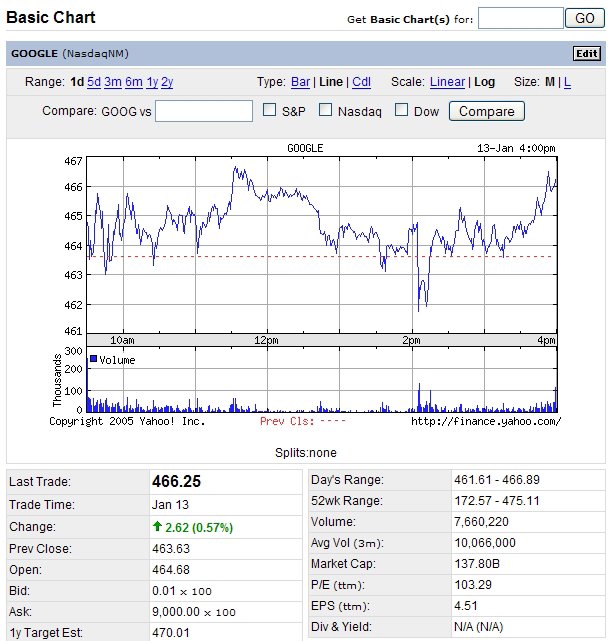
Most stock-quote systems such as Yahoo! Finance will automatically figure the price earnings ratio if you ask for a detailed quote on any company. I personally found the best ones to be Google Stock Quotes, just type in the ticket and the search results will do the rest.
Once you have the magic number, it's time you begin to wield its power. It can help you differentiate between a less-than-perfect stock that is selling at a high price because it is the latest hot-pick on Wall Street, and a great company which may have fallen out of favor and is selling for a fraction of what it is truly worth.
In addition to helping you determine which industries and sectors are over / under priced you can use the p/e ratio to compare the prices of companies in the same sector against each other. For example, if company ABC and XYZ are both selling for $50 a share, one is not more expensive than the other. Wrong!
Company ABC may have reported earnings of $10 per share, while company XYZ has reported earnings of $20 per share. Each is selling on the stock market for $50. What does this mean? Company ABC has a price to earnings ratio of 5, while Company XYZ has a p/e ratio of 2 1/2. This means that company XYZ is much cheaper on a relative basis. For every share purchased, the investor is getting $20 of earnings as opposed to $10 in earnings from ABC. All else being equal, an intelligent investor should opt to purchase shares of XYZ; for the exact same price ($50), he is getting twice the earning power.
Here is a sample chart (of Google : GOOG) that could to help you drill down these concepts.
Subscribe to:
Comments (Atom)